
When you are investing, you are often looking for investments with the lowest potential risk and the highest potential returns. More risk usually means a higher return; however, it can also mean bigger losses. To help minimize your risk and maximize returns, you can use standard deviation in investing: a tool that helps investors measure the historical volatility of investments. The importance of this lies in the principle that losses hurt more than gains help.
Learn How to Beat the Stock Market – Watch Our Webinar
What is Standard Deviation?
As a physician, you’re likely familiar with statistical concepts like standard deviation. You may use them in academia, medicine, and finance. But did you know this term is just as important for investing?
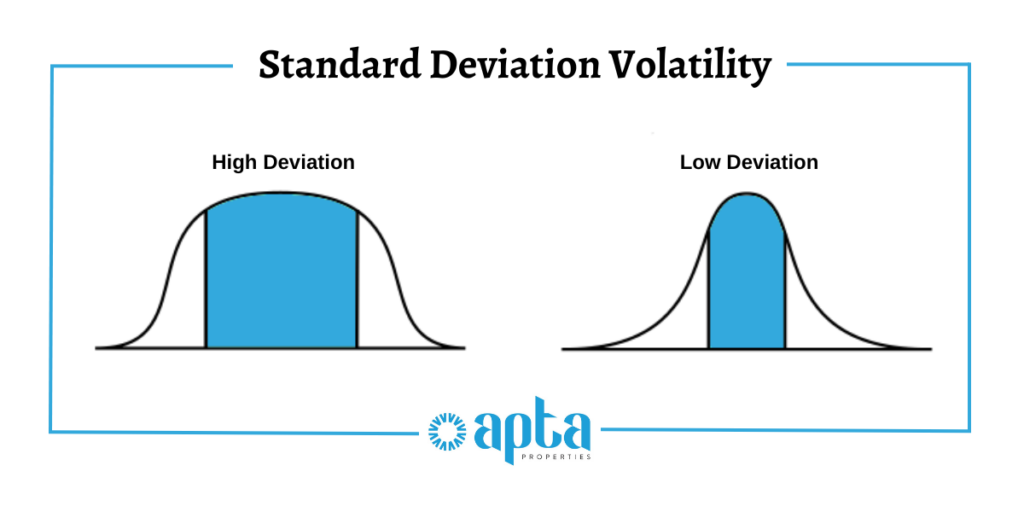
Standard deviation is a statistical model that measures market volatility and, in turn, the risk which measures how widely prices are dispersed from the average price. Standard deviation isn’t necessarily a term that professionals talk about on a regular basis like the P/E ratio, dividend yields, and expense ratios, however, it is one calculation that is used to analyze and determine the historic risk of a particular investment of your portfolio.
The greater the standard deviation, the more dispersed range of returns an investor can expect. A smaller standard deviation predicts more consistent returns. A higher standard deviation doesn’t guarantee great returns: rather, this indicates a greater risk, but greater potential returns. A smaller standard deviation is less volatile and risky but is unlikely to deliver extraordinary returns.
How Standard Deviation in Investing is Used to Determine Risk
Analyzing standard deviations helps show which investments have long-term stability. Below are two example investments:
Investment 1:
Average Rate of Return: 10%
Standard Deviation: 5%
Investment 2:
Average Rate of Return: 10%
Standard Deviation: 12%
Let’s compare their performance:
Both investments have the same average rate of return, though with different standard deviations. Investment 2 has a higher standard deviation, which can potentially mean within one standard deviation or 67% of the time that you could earn up to 22% this year but lose 2% next year. That indicates and reflects the investment’s much higher volatility. Even though the average returns are the same, there is still a higher chance of dramatic swings in your investment. Because Investment 1 has the same average rate of return but a lower standard deviation, it is safer and has less risk. Remember, losses hurt more than gains help, so Investment 1 returns more in the long term.
Long-term investments are key to financial freedom. So, determining the standard deviation is an excellent way to calculate your future portfolio and to determine if your current investments are too risky, too conservative, or just right.
How to Calculate Standard Deviation
Step 1: Calculate Average Returns
An investment’s standard deviation is calculated by measuring the fluctuation of the average return over a period of time. In this example, we have used 36 months. To find the average, add up the 36 monthly returns and divide by 36.
Example: Average Returns = (-1.31 + 4.23 + 5.32 + -1.11 +…) / 36 = 2.30
Step 2: Determine the Square of the Difference Between the Monthly Return and the Average Return
Once you have the average return, you need to find the square difference between the actual rate of return and the average rate of return for each month.
For Example: Let’s say we take an actual rate of return from the above equation, –1.31, and make that return for January.
So, in January, it would be (-1.31 – 2.30)2 = 13.03 and February would be (4.23 – 2.30)2 = 3.72
Repeat this process for all 36 months and then add them all together (13.03 + 3.72 +…) = 162
Step 3: Divide the Results
Divide the amount from step 2 by the number of data points minus one: 162 / (36 – 1) = 4.62
Step 4: Take the Square Root
Then finally take the square root of the result to find the standard deviation.
√4.62 = 2.15%
One standard deviation above and below the average return means that 68% of the time, your returns are within that range. For two standard deviations, that percentage is 95% and three standard deviations that percentage is 99.7%.
Apta Properties, Your Investment Experts
Long-term investments like multifamily real estate offer many benefits, one of them being great returns while being a low standard deviation investment. Adding multifamily investing to your portfolio is one of the best ways to ensure growth—especially in times of economic turbulence. When it comes to your long-term investments, it’s important to remember they take time to grow and develop into a healthy and secure nest egg. You may not see the returns immediately, but in the long run, they are more consistent and stable than other types of investments.
When it comes to investing in your future, Apta Properties is here to help guide you through the journey to financial freedom. If you want to learn more about different types of investments and how to live your best life through passive income, schedule a consultation with our team today!